
In previous post, we installed Grafana on server. Now, we are going to install OCI Plugin for Grafana and set up monitoring.
Login to server and check grafana cli is working or not.
login as: opc
Authenticating with public key "rsa-key-20200220"
[opc@grafanaoci ~]$ sudo -i
[root@grafanaoci ~]# grafana-cli
NAME:
   Grafana cli

USAGE:
   grafana-cli [global options] command [command options] [arguments...]

VERSION:
   6.6.2

AUTHOR:
   Grafana Project <https://github.com/grafana/grafana>

COMMANDS:
     plugins  Manage plugins for grafana
     admin    Grafana admin commands
     help, h  Shows a list of commands or help for one command

GLOBAL OPTIONS:
   --pluginsDir value       path to the grafana plugin directory (default: "/var/lib/grafana/plugins") [$GF_PLUGIN_DIR]
   --repo value             url to the plugin repository (default: "https://grafana.com/api/plugins") [$GF_PLUGIN_REPO]
   --pluginUrl value        Full url to the plugin zip file instead of downloading the plugin from grafana.com/api [$GF_PLUGIN_URL]
   --insecure               Skip TLS verification (insecure)
   --debug, -d              enable debug logging
   --configOverrides value  configuration options to override defaults as a string. e.g. cfg:default.paths.log=/dev/null
   --homepath value         path to grafana install/home path, defaults to working directory
   --config value           path to config file
   --help, -h               show help
   --version, -v            print the version

[root@grafanaoci ~]#
Then list the plug-in from CLI commands.
[root@grafanaoci ~]# grafana-cli plugins list-remote|grep oci
id: oci-datasource version: 1.0.2
[root@grafanaoci ~]#
After that install the plug-in.
[root@grafanaoci ~]# grafana-cli plugins install oci-datasource
installing oci-datasource @ 1.0.2
from: https://grafana.com/api/plugins/oci-datasource/versions/1.0.2/download
into: /var/lib/grafana/plugins

? Installed oci-datasource successfully

Restart grafana after installing plugins .

[root@grafanaoci ~]#
On sucessful installation of plug-in, restart the grafana server and check the plug-in has installed or not.
[root@grafanaoci ~]# systemctl restart grafana-server

[root@grafanaoci ~]# grafana-cli plugins ls
installed plugins:
oci-datasource @ 1.0.2

Restart grafana after installing plugins .

[root@grafanaoci ~]#
Now, login to console with admin account.

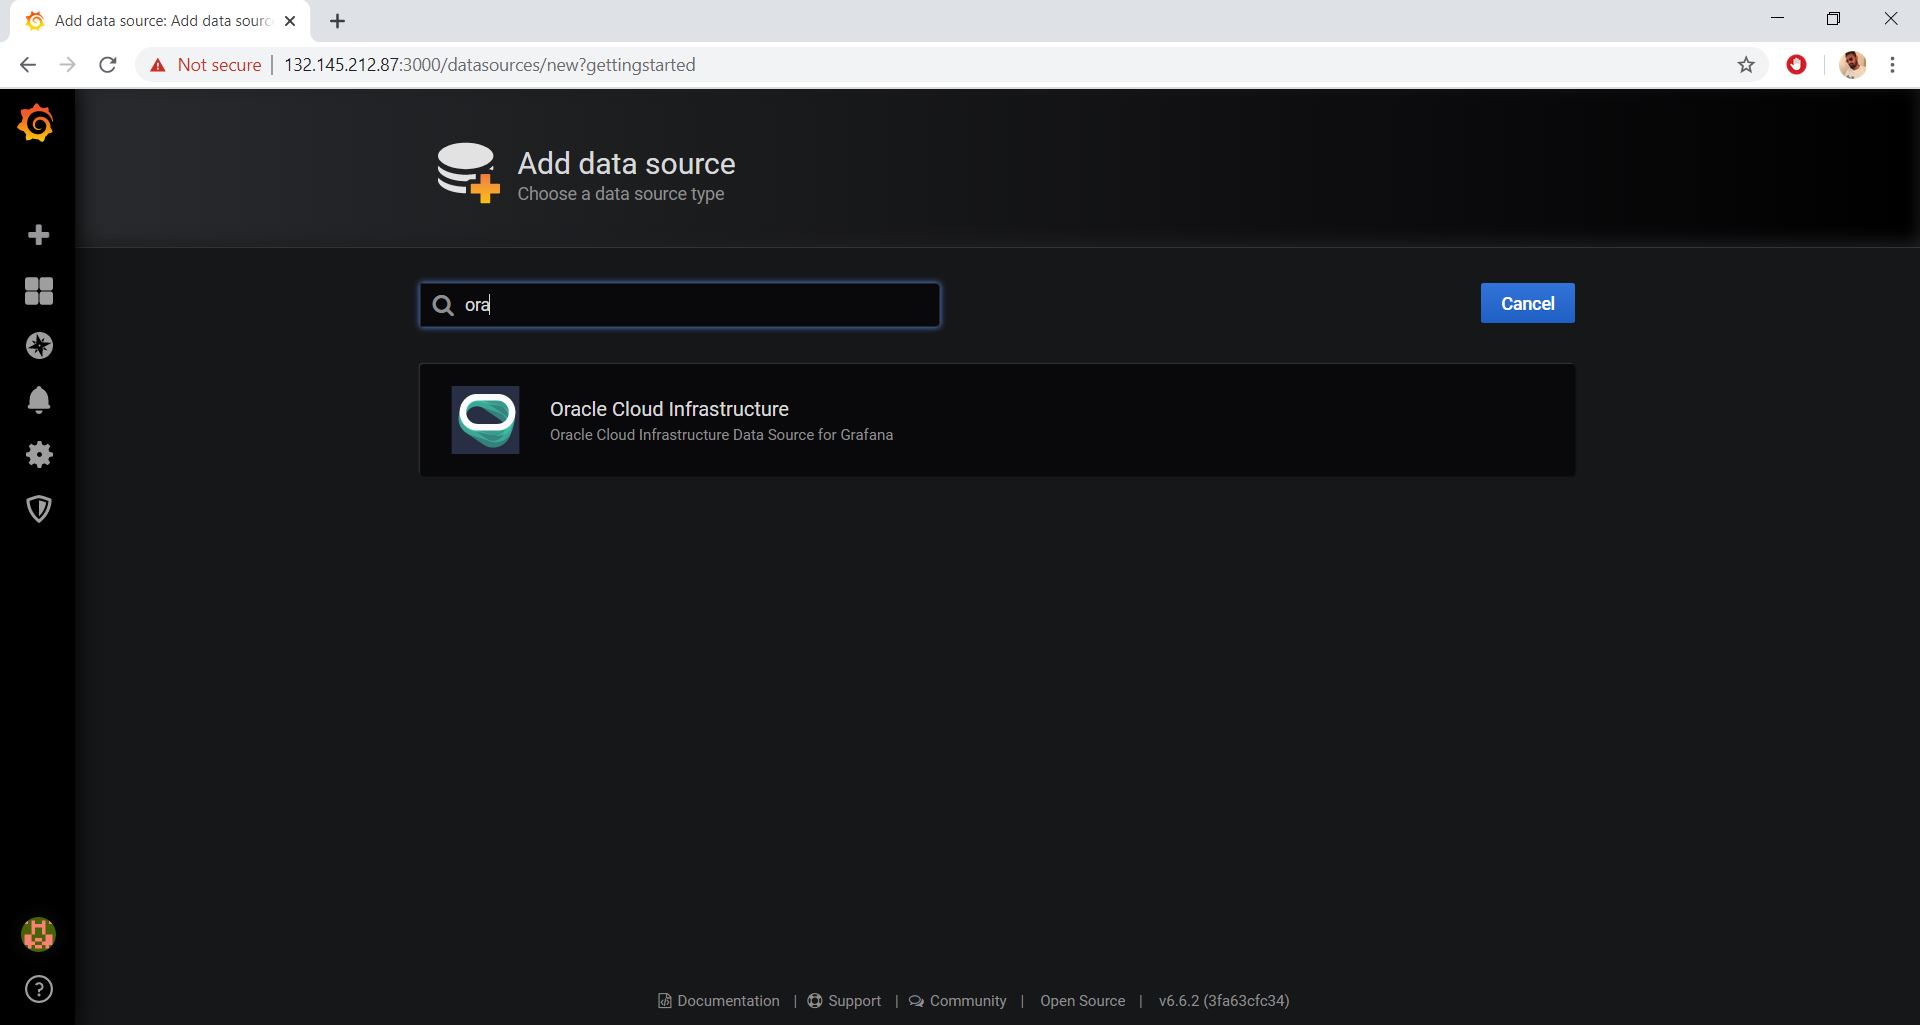
Click on “Add Data Source“.
Search for “Oracle Cloud Infrastruture” data soucre.
After the data source, the following things:
- Tenacny OCID
- Default Region
- Environment

Click on “Save & Test“. Check the whether data source is working.

Now, press on the “New Dashboard“.
Then select the “Add Query” option.

Then, select the Region, Compartment, Namespace, Metric and Aggreation method the menu.

You can the visualization Graph, Gauge and many more.
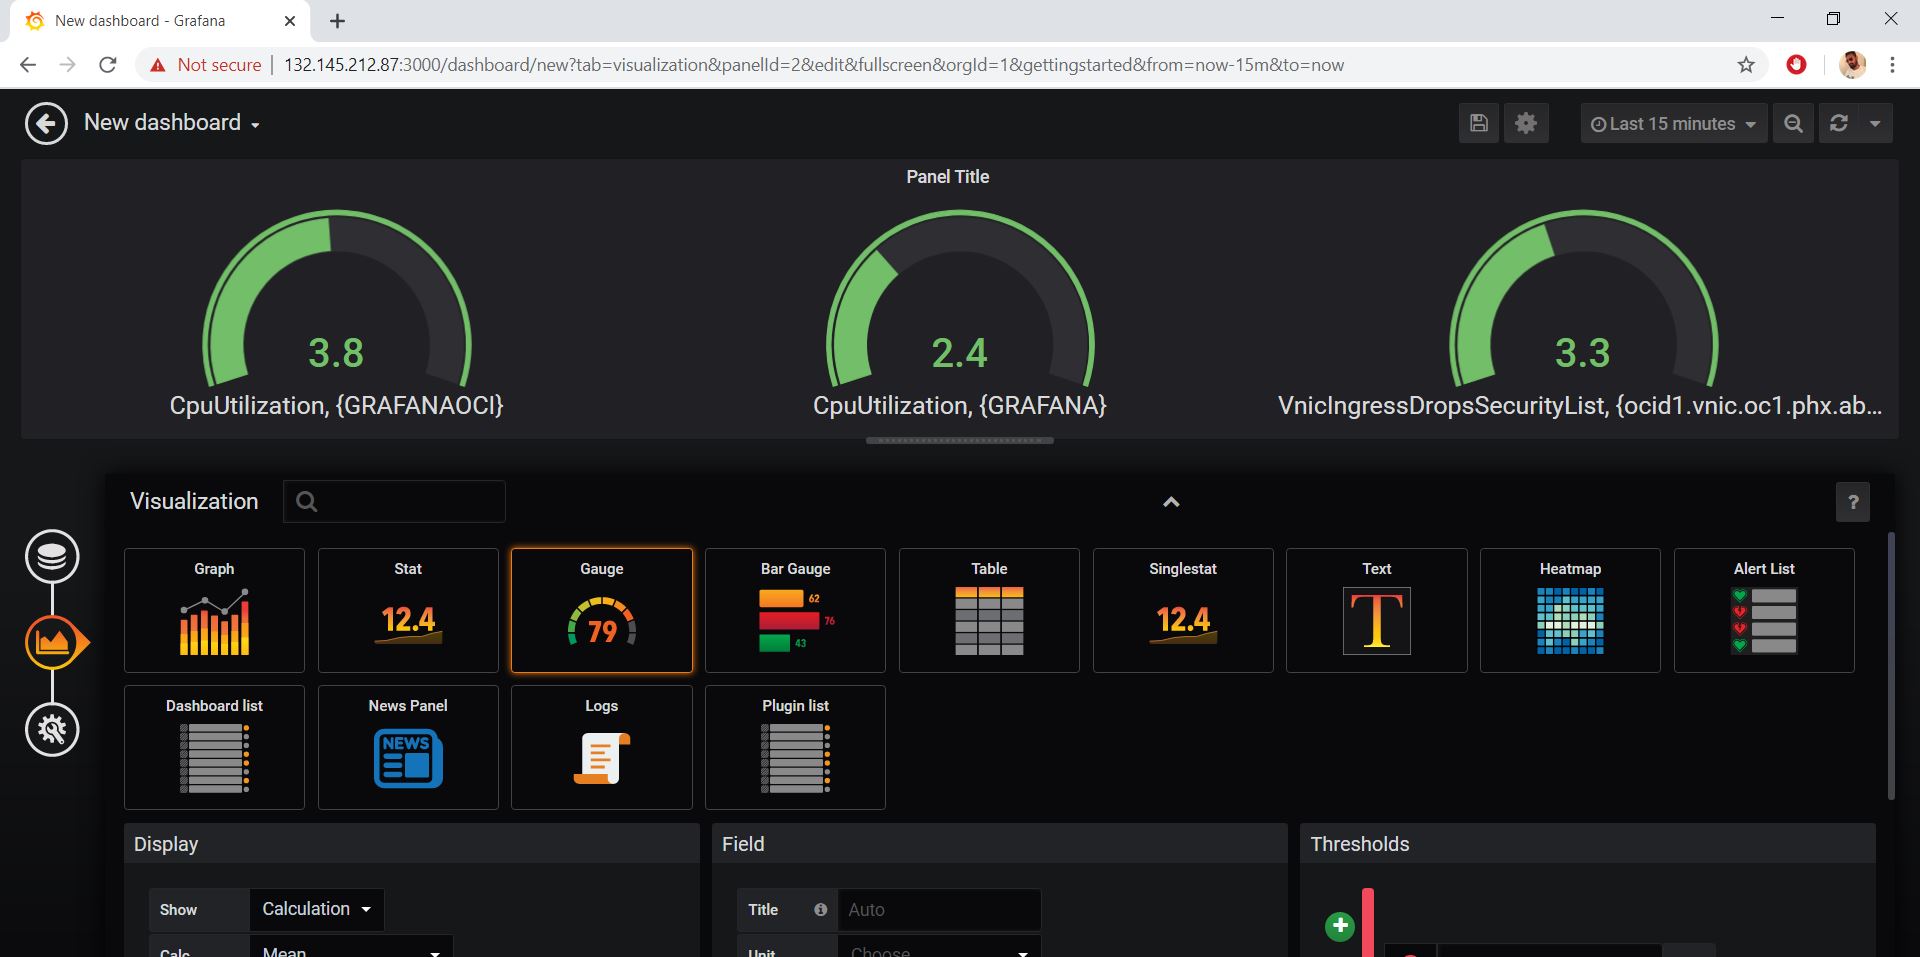
Then Click on “Save” icon on the top right side.

You can add user to access as viewer and click on “Add User“.
Then the detail for new users.

To know more about customization in Grafana.
https://grafana.com/grafana/plugins/oci-datasource
Thank you for giving your valuable time to read the above information.
If you want to be updated with all our articles send us the Invitation or Follow us:
Telegram Channel: https://t.me/helporacle
Skant Gupta’s LinkedIn: www.linkedin.com/in/skantali/
LinkedIn Group: Oracle Cloud DBAAS
Facebook Page: OracleHelp

Pingback: Monitor a MySQL Database Service (MDS) DB System with Grafana - mortensi